Food Effect on Glucose
Using a model to describe the effect of food - Article 4 of 7 in Systems Approach Series

Modeling Food to Glucose Process
Many physiologic processes in the body have been described with a model-based structure. Insulin absorption was modeled as early as 1959, and compartment models for it followed. Insulin’s effect on glucose was modeled with compartment to compartment flows as well. This incorporated both production in Type 2 patients and disposal, including how it was potentially diminished by insulin resistance. When it comes to food, a compartmental model is especially appropriate, because the physical process food goes through consists of moving from one compartment to another.
It was some five year after coming down with Type 1 Diabetes that I first tried to model food absorption. I worked on it because I had learned of the other models that existed at the time, and realized one for food was still lacking. My background in experimental physics, mathematical modeling and parameter identification, and what I had learned about physiology enabled me to at least try to do it myself.
I started work on it in 1990 when test strips finally had meters that could provide a numeric glucose estimate and made model identification possible. I used two different food inputs for my analysis:
- Non-diet cola (either beet sugar or corn syrup) as a common fast-acting food source
- A combination of bread (bagel) and cream cheese (mostly fat with milk protein) for one that required some digestion time
There are carbohydrates that are slower to absorb, such as potato, but at that point, I just wanted to see if a compartmental model would work, and how the model parameters for these two foods differed. Carbohydrate was the main interest, so foods that are primarily vegetable or protein were ignored.
Experimental setup
I wanted to isolate the effect of the food, without the confounding effect of insulin. This meant using a C-Peptide negative subject, which meant my own data, but when glucose was not otherwise changing. To do so I measured the data in the afternoon when my basal dose had BG steady without eating lunch or anything else after breakfast. In this way, any glucose change due to food could be taken to represent its effect, absent any confounding bolus.
I ate a measured amount of the food: 42 grams of carbohydrate in the cola for the simple carb food, and 84 grams of carbohydrate for the bagel and cream cheese complex carb food. I then measured BG for two hours using a meter[1] that did not require test strips, an important cost-saving at the time. I could measure BG every four or five minutes, given the time needed to clean the sensor between each use.
My insulin regimen was a dose of morning NPH that was titrated to achieve steady BG during the afternoon absent any food eaten after breakfast. With that meal being over six hours earlier, it was well past absorption and conversion to glucose itself. Thereby the test food was the only thing to change BG during the afternoon test period. I tried this several times, and glucose never changed more than 9 mg/dl during the two hours the test measurements would last. This defined the largest possible error for the effect of the foods themselves. The food tested changed my BG by about 135 mg/dl, taking BG from 80 to 215 mg/dl, with no more than 4% error from any underlying basal BG drift.
The testing itself consisted of eating the food and after ten or fifteen minutes measuring BG over and over again until the value obtained stopped rising and looked to have leveled off. This took about an hour for the drink, and well over two hours for the bagel. After plotting and analyzing the data, I determined I hadn’t really measured long enough for it, but at that point, it was too late to do it all over again. Fortunately, there was enough of a response curve to estimate the model parameters I wanted.
Note: The meter I used was the ELCO Direct 30/30 which had only been on the market for a year or so. As with the test strips used later, this meter measured BG, not interstitial glucose.
Data analysis
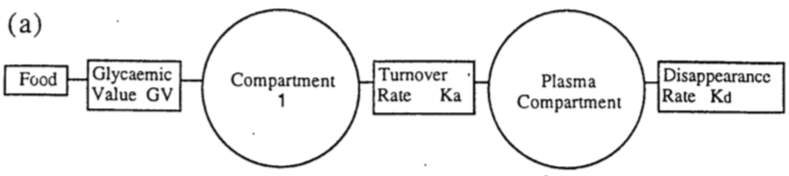
Once I had the raw BG data, I tried to fit parameters for several compartmental models to see how well they predicted the actual effect of eating the food I tested. I tried three-compartment, two-compartment, and one-compartment models, each followed with a plasma compartment for the final destination, which was what I measured with the BG test meter.
In the end, the one-compartment model, with a parameter for transport delay, was slightly better than the more complicated models. The mouth, throat, stomach, and duodenum all act like one big compartment, in effect, after which the glucose finally reaches circulating blood plasma.
The parameters for this model consisted of:
- “Glycemic Value” for the food, roughly the fraction of the food input, its Total Available Glucose (TAG), that eventually appears as glucose
- “Rate Constant” the fractional turnover rate (Ka above), or the percent of the compartment that moved on to the next per minute
- “Transport Delay”, the time taken after eating for the food effect beyond that inherent in the rest of the model
These parameters varied, some significantly, for different kinds of food.
I ran the tests once in 1990 and repeated them again in 1995 three times more. The model parameters I identified for all these experiments were remarkably similar between the two years and from test to test in 1995.
- Glycemic Value of the drink ranged from 0.195 in 1990 to 0.151, 0.163 and 0.231 in 1995
- Transport Delay ranged from 1.25 to 1.29 and 1.41 minutes
- Rate Constant varied the most depending on the food, and was 0.05 for the drink vs. 0.002 for the bagel, while within the same food it differed very little.
Model Parameters vs. Glycemic Index
The three parameters of this gut model have a physiologic meaning that can be used to represent the food, or combination of foods. The Glycemic Index, on the other hand, is calculated as the ratio of the integrated glucose response of the food at issue normalized to the glucose response of the same quantity (weight) of bread. This glucose response curve is usually measured for a normal, non-diabetic, subject, thereby confounding that subject’s insulin response and insulin sensitivity, as well as digestion of the food, rather than just the effect of the food itself.
In this gut model, on the other hand, the Glycemic Value may correspond to the total available glucose (TAG), while the Rate Constant could depend on a combination of fat and fiber in the food. The advantage to this kind of compartmental model using parameters that can be estimated for a given food, and even a combination of foods, is that it may be used for a model-reference control strategy, where the predicted result (glucose) of the stimulus input (food) is used to determine the amount of control input (insulin) needed. In particular, when you know the expected time course of glucose into the future, measuring BG at a suitable time after eating would thereby enable seeing what the BG would likely be at the next meal, enabling a compensating action (such as an insulin supplement or a small amount of carb) should that ultimate BG value not be what was intended.
Summary
It is possible to model the glucose rate of appearance in plasma (BG) from the gut that results from any food, from rapidly absorbed sugars to slowly absorbed complex carbohydrates and fat. The model developed here consists of three parameters:
- The fraction of the food that turns into plasma glucose (the Glycemic Value)
- The fraction of gut content that moves on per minute (Rate Constant of Gastric Emptying)
- The time delay going through this process (Transport Delay)
These parameters accrue to the food alone and are not confounded with the subject’s insulin production or sensitivity, as occurs with the Glycemic Index. While it would take considerable effort to compile parameters for as many foods as currently exist for the Glycemic Index, it would be a boon for use in aggressive glucose control for those with T1D.
The problem with the Glycemic Index is that it was created primarily to market foods, similar to today’s ‘gluten-free’ or ‘organic’ food labels. All the people tested were T2D, which were easier to recruit for testing, but who each had different underlying physiology (some being insulin resistant, some deficient in insulin production, some with more body mass than the pancreas can support, and other differences, including exercise). That’s why the Glycemic Index isn’t worth much, scientifically, as a truly generalizable measure of the effect of food, especially for those with T1D.
Acronyms and References
(see Master List)
|
BG (Blood Glucose) |
|
|
C-Peptide |
|
|
Glycemic Index |
|
|
NPH (intermediate insulin) |
|
|
TAG |
https://kellywpa.wordpress.com/2010/11/10/total-available-glucose-tag-2/ |
|
titrate |
Content of Series
There are six articles in the series plus a dedicated section on Acronyms and References.
- My T1D Journey as a Systems Engineer
- Physiology of Managing T1D
- Food Effect on Glucose
- Basal Insulin Management in T1D
- Bolus Insulin Management in T1D
- Using CGMs, Insulin Pens, and Pumps
- Acronyms and References
See description of full article series here.